Real Time Page Level Time Charts
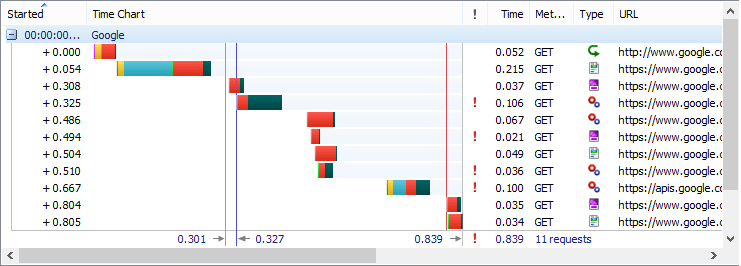
Page level time charts are displayed and updated in real-time as you record requests in HttpWatch. This gives a direct, visual indication of how a site is performing - allowing common problems to be diagnosed at a glance.
Millisecond Accurate Request Timings
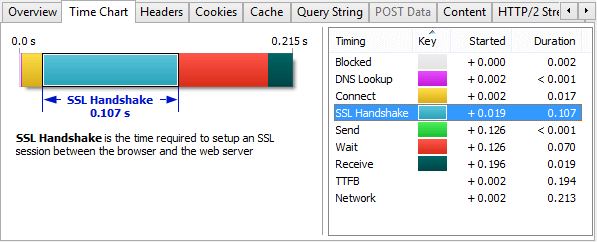
The time chart displayed for each request is broken down into a number of colored sections to show network level timings such as DNS lookup, TCP connect and SSL Handshake
Page Event Timings
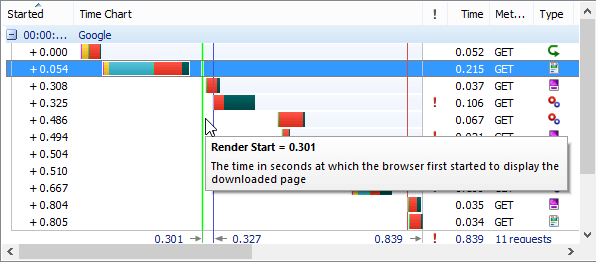
HttpWatch is able to show browser event timings alongside the network level HTTP waterfall chart. Timings such as the Render Start and Page Load events are useful metrics for determining when content starts to be displayed and when the page appears to be complete.
Automatically Detects Performance Issues
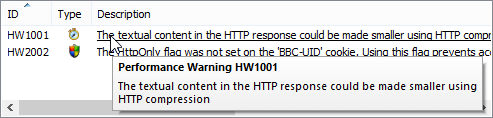
Performance warnings are displayed when the speed of an HTTP request or resource download could be improved. The warning includes information about how the web server should be configured to avoid the issue.