Seamless Web Page Debugging
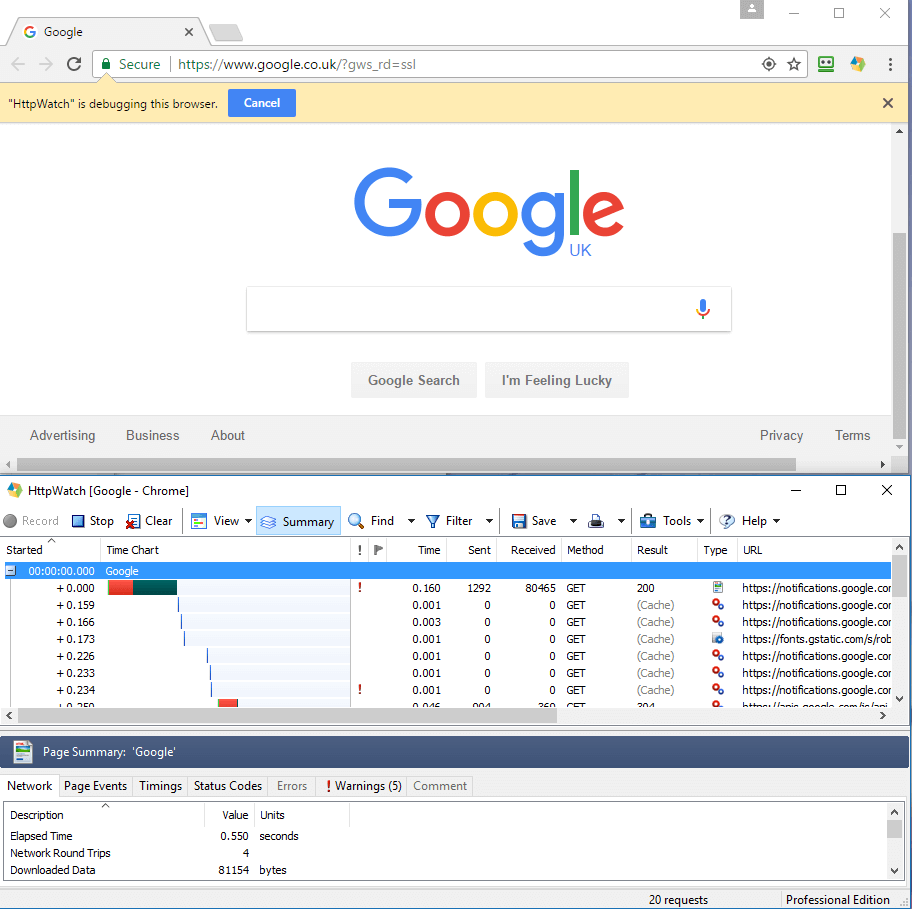
HttpWatch integrates with Chrome and Edge browsers to show you the HTTP and HTTPS traffic that is generated when you access a web page.
Fast, Easy Access to Cookies, Headers & More...
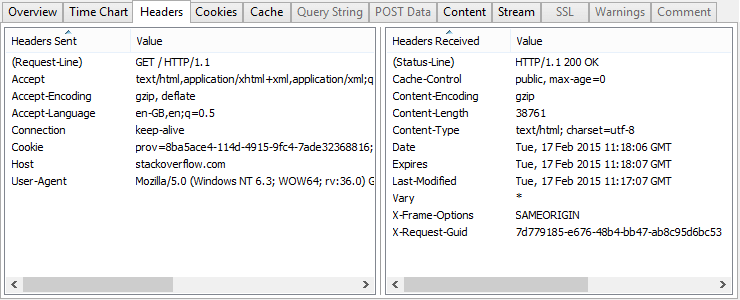
Select a request in HttpWatch and everything you need to know is displayed in a tabbed window. Cookies, Headers, Query Strings and POST data can be quickly viewed, searched and exported to other formats.
Understand HTTP Headers Without Being An Expert
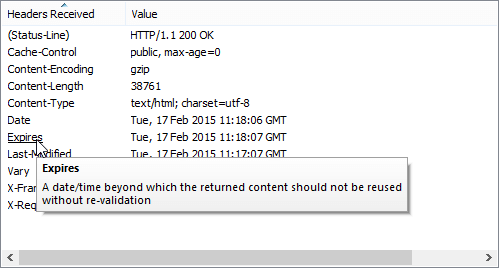
You don't have to be an HTTP expert or have read the HTTP RFC to understand headers. Simply hold the mouse pointer over a header and a data tip explains how it is used.
Handle Multi-Page Scenarios With Page Grouping
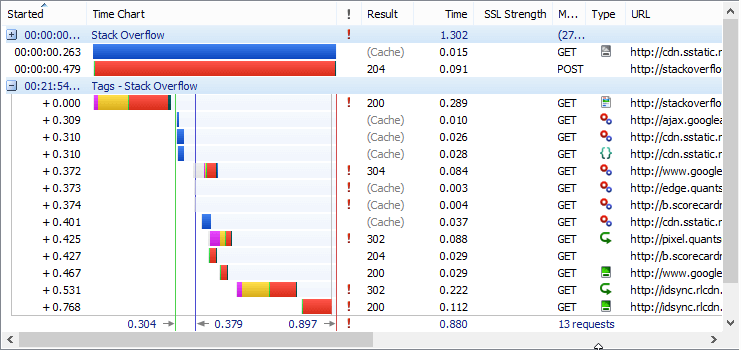
HttpWatch groups together requests within a heading for each page making it much easier to understand multi-page steps, e.g. log in, search and update pages.
Track Cookies Set by JavaScript
HttpWatch captures cookies assigned through JavaScript as well as cookies sent and received through HTTP headers. A JavaScript column in the Cookie tab shows the source location where each cookie was set, making it easier to diagnose authentication problems, consent issues and tracking bugs.
Full Visibility of Cookie Attributes and Blocked Cookies
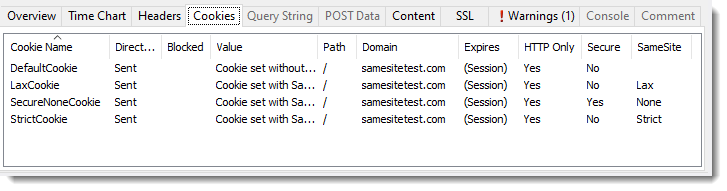
The Cookie tab displays all attributes of sent cookies such as Path, Domain, SameSite and Secure flags. HttpWatch can also show cookies that were blocked by the browser along with the reason for blocking, with warnings HW3007 and HW3008 highlighting blocked cookie issues automatically.
Warnings for Incorrect Content Types and Headers
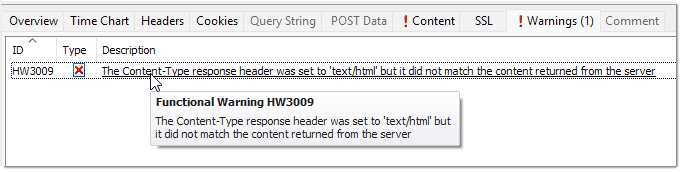
HttpWatch detects when a server returns content with an incorrect content type or header and raises warnings HW3009 and HW3010 to identify server-side misconfigurations. When HTML, JavaScript, CSS, JSON or XML is detected with the wrong MIME type, HttpWatch automatically applies the correct formatting in the Content tab.